Tracking Acceleration During A Hockey Game
Acceleration and velocity are present everywhere in life, from sports to driving, to walking around. With PASCO’s Wireless Acceleration Altimeter, I decided to see what I can learn from the 7 different data points that it records.
As a hockey player for 18 years, I’ve always wondered how quickly I’m moving on the ice, having never seen myself skate or recorded my speed. I assume of course, that I am right up there with Connor McDavid in terms of speed. I expect the sensor to be able to confirm that for me, while also telling me even more information – my acceleration and velocity in the x, y, and z directions.
The first step in my experiment was to put the sensor into remote data logging mode, so that the altimeter is recording data into its internal storage, instead of needing to be connected to a phone or computer.
When setting up the altimeter, I changed the frequency to 5 Hz, (5 data points per second). The altimeter can record up to 200 Hz but has a limited capacity for how much data it can keep in its internal storage. Once I had put the sensor into remote data logging mode, I used the included Velcro straps to attach it to the back of my shin guard and got ready to step onto the ice.

For the first 9 minutes of the data recording, I am putting all of my equipment on, so the velocity and acceleration are relatively low as I stay within the dressing room. At the 10-minute mark warm-up begins. For these 5 minutes, I’m constantly moving while I’m skating on the ice, so the acceleration is constantly changing and staying at numbers of higher magnitude.
The magnitude of the data is also slightly decreasing during the 5-minute stretch as I slow down and conserve more energy for the game. When comparing the peaks of this stretch to the peaks of acceleration later on, it’s clear that I wasn’t accelerating as much in warm-ups as I would be when I was playing the game.
At the 15-minute mark, the game begins and I’m on the bench for the first shift, but at 18.5 minutes I get on the ice. There are bursts of acceleration as I get up to speed and little sections of coasting until 19 minutes when there’s a stoppage in play and the acceleration goes down and remains relatively constant. When the play resumes my acceleration begins to spike and then fluctuates throughout the natural progression of the game, as I coast at times and race to get the puck at others.
Over the course of the rest of the game, the peaks and valleys of the graph show clearly when I was on the ice accelerating and decelerating, and when I was on the bench, with the little movement just being from sliding across the bench or standing up to cheer on a goal.
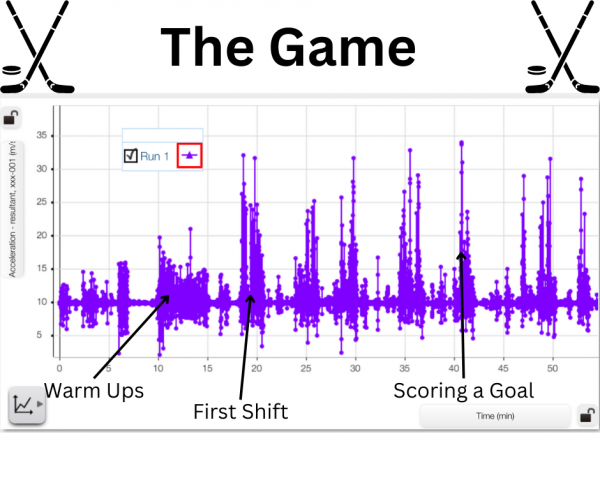
In the different peaks in the graph, it can be seen which shifts I accelerated the most, and which I had a bit less energy. On the first shift of the game, my peak acceleration is 32 m/s2, which is high, but not the highest acceleration of the game. On this shift though, there are 60 data points where my acceleration is greater than 15 m/s2.
Because we are recording at 5 Hz, we can take that to mean that there are 12 seconds in which my acceleration is greater than 15 m/s2. This is not all in one 12-second stretch though, it’s spread out throughout the shift in groupings or bursts of acceleration. By comparison, the shift with the next highest amount of data points over 15 m/s2 is my 4th shift, in which there are 50 such points, or approximately 10 seconds. This 2-second difference is evidence to point towards my fatigue, as the number of such data points decreased more as the game went on, with the final full-length shift containing only 34 of these points (6.8 seconds).
The highest acceleration recorded is 34 m/s2, and that is on the 5th shift of the game. It would seem abnormal that my highest acceleration would be on the 5th shift, as I am already more tired at this point. There is context to explain the abnormality though – on the 5th shift we broke out on a 2-on-1 and I had to accelerate as fast as I could to free myself up to receive the pass and score a goal.
Overall it was a very interesting and insightful experience looking into the data surrounding my skating and gameplay. While I don’t think my acceleration is quite up to par with Connor McDavid, I can say I’m satisfied with my results and happy that the data logging had ended by the time I ended up in the penalty box.
With the Acceleration Altimeter, there are so many cool and interesting ways to record and examine data, and I got a fascinating look at just one of the possibilities by taking it with me during my hockey game. Additionally, there are other data points that weren’t useful for my experience, with angular velocity, altitude, and acceleration in the z direction – playing hockey on a flat sheet of ice somewhat limits how much vertical movement can be performed. I’m excited to dig deeper into the data and for other possibilities and opportunities in the future to learn more, using PASCO’s wireless sensors.
Featured Products:
 integrating coding into the curriculum.
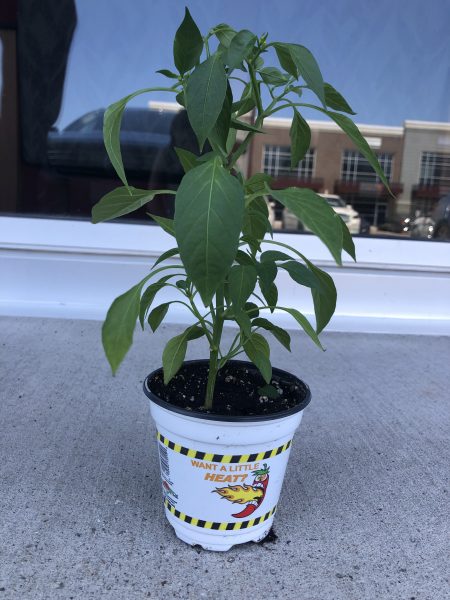
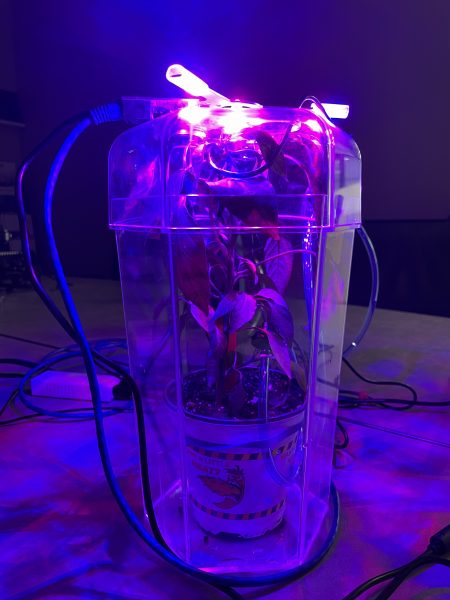 In our experience with the Greenhouse Sense & Control Kit, we decided to design an environment for a Ring of Fire Pepper Plant. We had to research conditions that would be essential for the plant to grow. This included factors such as relative humidity, temperature, soil moisture, hours of sunlight, and how much water it needs each week. The Greenhouse Sense & Control kit provides the materials for students to design the greenhouse for the plants’ needs. Through code, you can program a fan, grow light, and irrigation system to provide the optimal conditions for your plant. This teaches students how changes due to soil, water, air, and temperature in an ecosystem can affect a plant’s growth in good and bad ways. The activities provided by this kit allow students to learn about ecosystem sustainability firsthand and in real-time.

 For the past week, Mia and I have been working on a new project involving a pepper plant named Pete, the SPARKvue software, and PASCO’s new Greenhouse Sense and Control Kit. Pete is a Ring of Fire pepper plant which thrives in temperatures between 26-29 degrees Celsius and a relative humidity of around 70%. We knew that we had to set up Pete’s optimal conditions if we wanted him to grow and produce any peppers, so Mia and I immediately got to work on it. We started by setting up the greenhouse itself, including the fan and grow light accessories, followed by the greenhouse sensor which includes a soil moisture probe and the temperature, humidity, and light sensing pc board. Once we connected the //control.Node to our laptop we were able to begin the programming process. Using the information available on the PASCO website, we were able to create simple code designed to regulate the temperature and relative humidity by activating the fan accessory anytime the relative humidity level went over 75% and deactivating the fan accessory once the level drops back down to 70%. This would keep the relative humidity within the desired 70-75% window. We also found that this would keep the temperature of the greenhouse between 25-26 degrees Celsius, ensuring that ideal conditions for the Ring of Fire pepper were met.
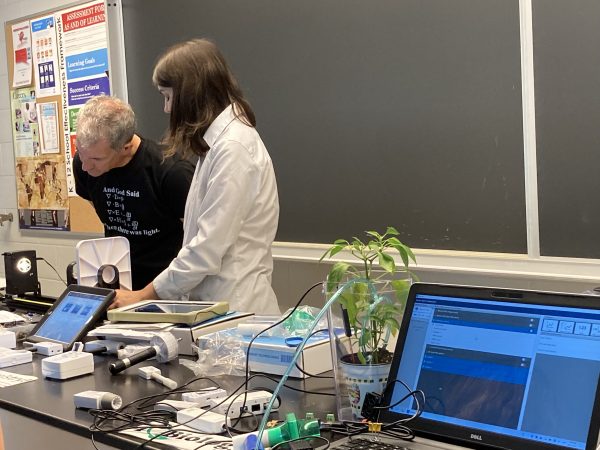 It was great to be back in person interacting with teachers! We discussed ways to integrate PASCO products into the classroom to create a fun, educational, and hands-on environment for students.
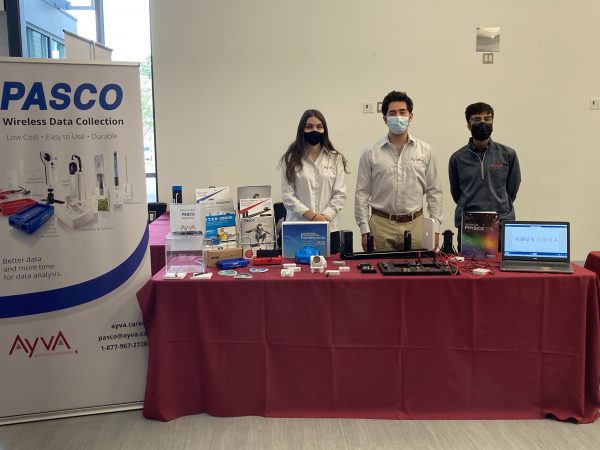
 Extension: Vector Display
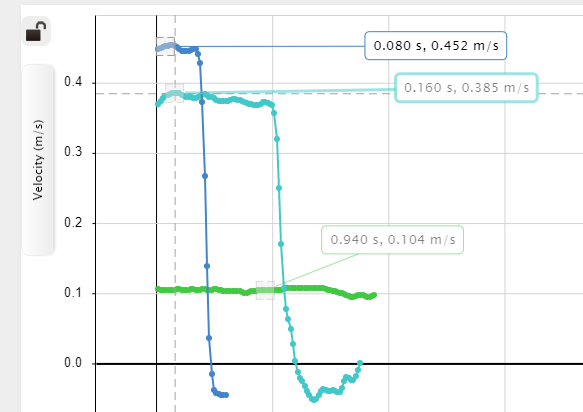
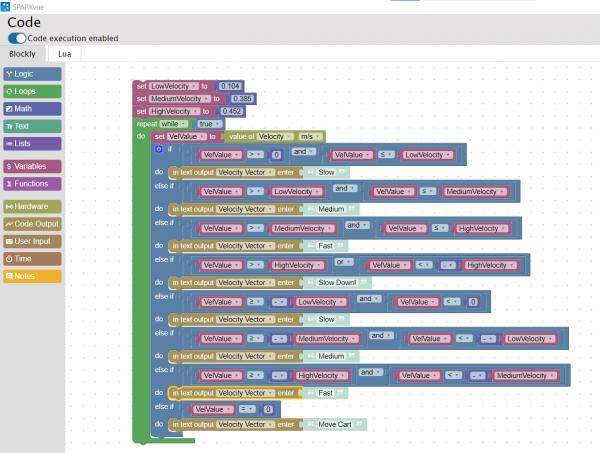 the ones I recorded, as shown in the image on the left. I tested my code by clicking start and moving the Smart Cart. At first, I was not sure where to look for the displayed text. I realized I had to change my display from a graph to digits. Then, by clicking the variable being displayed, I switched from Sensors to User-entered and chose Velocity Vector (the variable I created in the Blockly code). This time when I pressed start, the vectors I assigned to each velocity displayed on the screen depending on the Smart Cart’s speed. I decided to change the text displayed from vectors to words. As shown in the video below, I used simple terms such as slow, medium, and fast to describe the carts’ velocities.
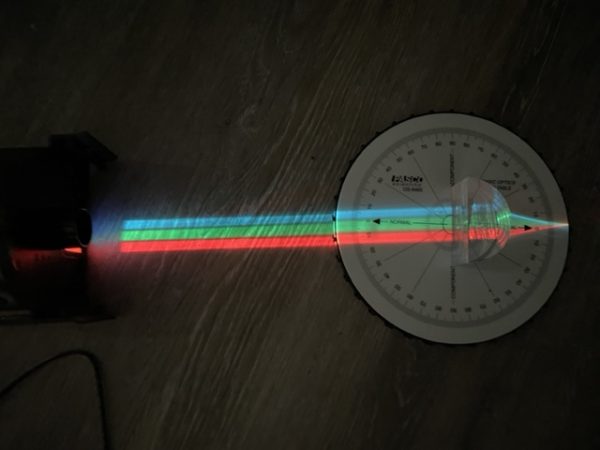 we used the Ray Table, the D-Shaped Lens, and the Light Source to perform a simple refraction experiment, using the PASCO Refraction lab as guidance as shown in the image on the left. This experiment was very easy to set up. All you need to do is plug in the Light Source and follow the instructions in the Refraction lab document. This experiment explores Snell’s Law, describing the relationship between angles of incidence and refraction.
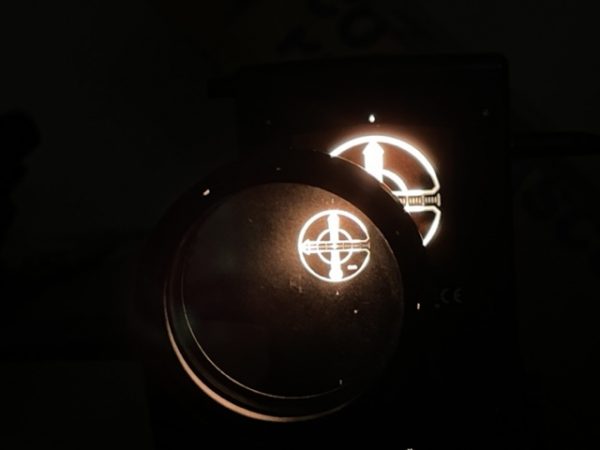
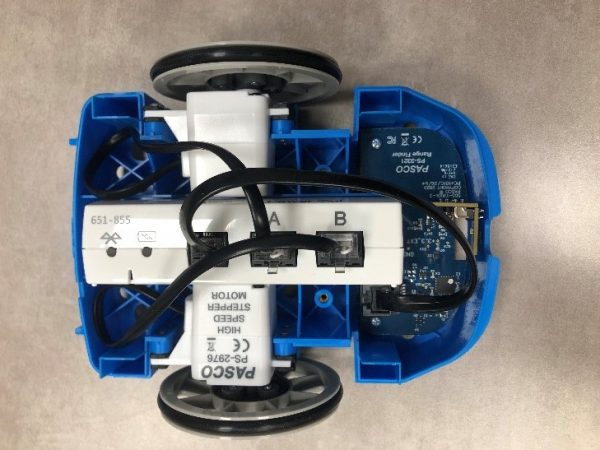
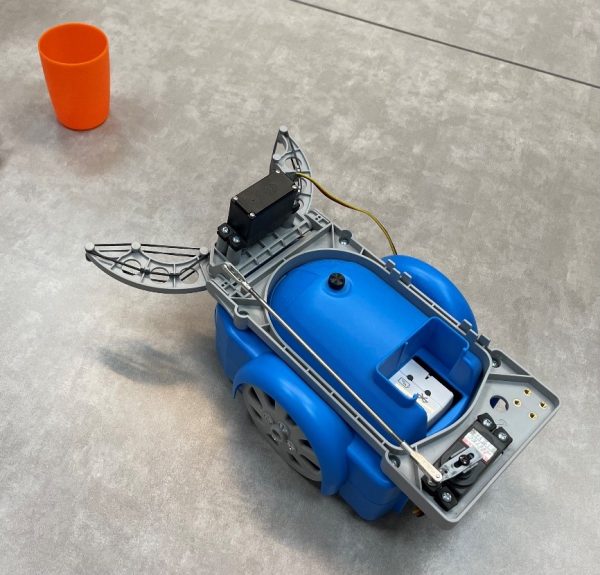
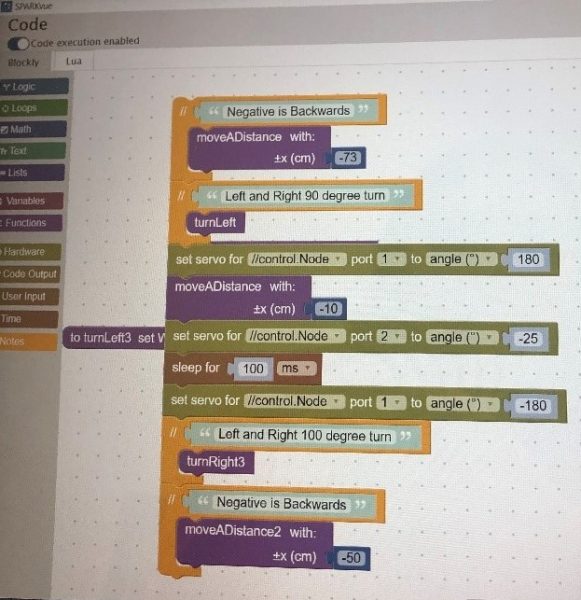 This inspired us to film a short clip in which the PASCObot would move a certain distance, turn left, grab a cup of water, turn right, and bring this cup to us. We started by measuring and marking a course then coding the robot using the measurements taken, as shown in the image on the right. We were able to successfully complete this task without spilling any water, and this allowed us to become more familiar with the system.
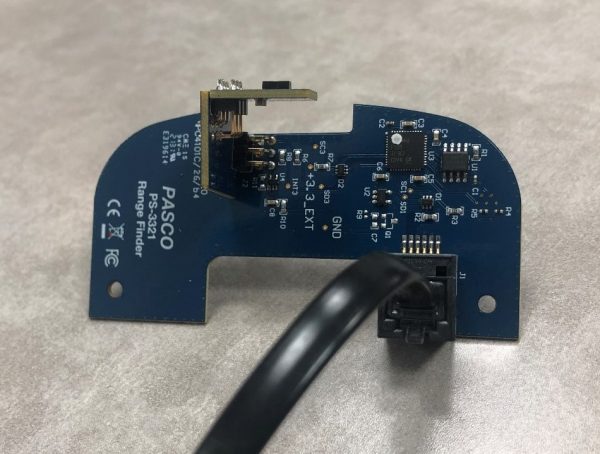 We then moved on to using the Range Finder Module, shown in the image on the left. This accessory was attached in the front of the PASCObot with two screws. A wire was then used to connect the Range Finder Module to the //control.node. The Range Finder Module uses infrared light to detect the distance from the PASCObot to objects. We followed the “Roving with Sight with the PASCObot” experiment from the PASCO Experiment Library and used the sample code. The code allowed the PASCObot to move on its own, avoiding objects, reacting to its surroundings, and maneuvering around the office floor independently. We found working with the PASCObot super cool and we are excited to try out more experiments.