English    |    Français

PASCO’s Exceptional 5-year Warranty

Most companies offer a one year warranty, and a smaller number have an extended warranty for two years.  PASCO’s five year warranty is exceptional and is demonstrative of a company that has immense confidence in the products they manufacturer and also capability to live-up to its promising when an issue arises.

“Happy customers are repeat customers, and keeping our word and your trust is simply good for business.”

                                                                                                            PASCO Teacher Support Team


What’s the catch?  Will PASCO really repair or replace a defective product for 5 years?  The answer is yes!  As long as the product was not tampered with or damaged due to misuse, PASCO will repair or replace the unit in a timely and efficient manner

A hassle-free process – PASCO does not want you to waste your valuable time and energy by needlessly jumping through hoops.  To process a warranty claim, a simple short conversation is often all that is required.  If a repair is required, return labels and shipping instructions will be quickly emailed.

Why PASCO can afford such a long warranty

Products are designed for student use – Student labs can be tough – really tough – on equipment.  PASCO has 55 years of experience producing long-lasting high quality instructional equipment and educational technology.  Thoroughly testing products before shipping to customers is also a critical step in the process.

Always be prepared – is the famous Scout moto that is central to PASCO’s commitment to honoring its warranty promise.  For at least 5 years after purchase PASCO will maintain a dedicated inventory of replacement units – even for products that have been discontinued.  In addition, PASCO has an extensive inventory of replacement parts and occasionally surprises customers (in a very pleasant way) by helping revive an old but still valuable piece of equipment that was purchased decades ago.

Free Spectrometry Software

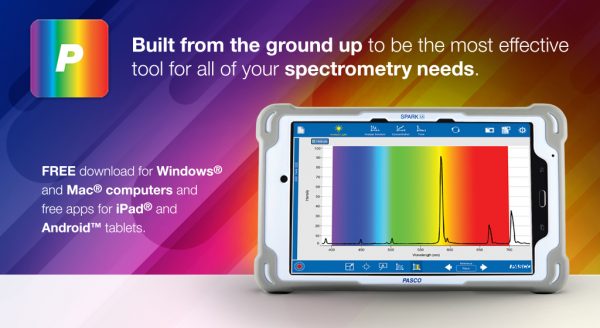
The Spectrometry application provides support for experiments including, analysis of emission spectra, absorbance spectra of colored solutions and plant pigments, Beer’s law determination of unknown concentrations, and kinetics experiments. The learner-centered interface makes it easy for all levels of students and teachers to integrate spectrometry into the teaching and learning of physics, chemistry, and biology.

Designed for use with our Wireless Spectrometer

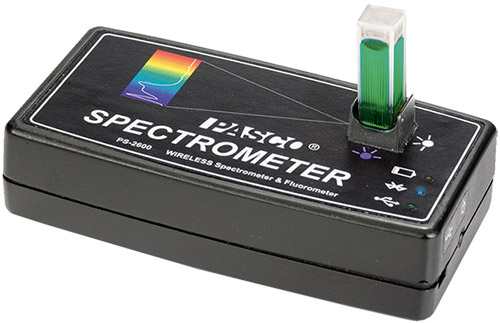
The Wireless Spectrometer measures emission spectra, intensity, absorbance, transmittance, and fluorescence. It easily connects to students’ devices and utilizes free PASCO Spectrometry software to display data and generate standard curves. Data is collected in less than a second, making it ideal for undergraduate labs constrained by time and technological resources.

  • Connectivity: USB or Bluetooth®
  • Fiber optic cable for emission spectra
  • Resolution: 2-3 nm FWHM
  • Range: 380-950 nm
  • 2 Fluorescence Excitation Wavelengths: 405 nm and 500 nm
  • Light Source: LED-boosted tungsten
Wireless Spectrometer

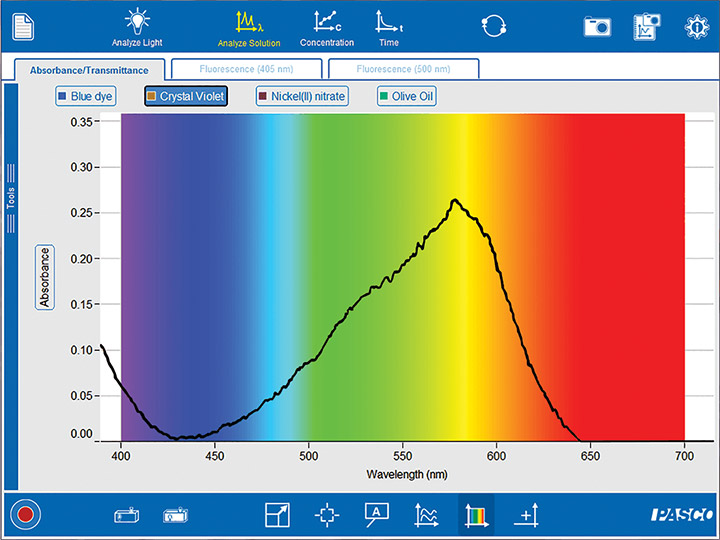
Spectrometry Crystal Violet Screen

Windows® Computers

  • Filename: Spectrometry_Win-2.2.1.2.exe
  • Filesize: 101.66 MB
  • Version: 2.2.1
  • Released: Jan 17th, 2019

Download for Free

 Mac® Computers

  • Filename: Spectrometry_Mac-2.2.1.2.dmg
  • Filesize: 22.72 MB
  • Version: 2.2.1
  • Released: Jan 17th, 2019

Download for Free

Free Apps for iPads, Android tablets, and Chromebooks.

The free apps may be downloaded directly from the App Store or Google Play respectively and update notifications will be sent directly to your device.


System Requirements

Windows
  • Windows 7 sp1 or later
  • Processor: 2 GHz or greater
  • RAM: 2GB or greater
  • Disk Space: 50 MB or greater
  • Resolution: 1024 x 768 or greater
Mac OS
  • Mac OS X v10.11 or later
  • Processor: 2 GHz or greater
  • RAM: 2GB or greater
  • Disk Space: 50 MB or greater
  • Resolution: 1024 x 768 or greater
Chromebook
  • Chrome OS v70 or later
iOS
  • iOS v9.0 or later. Compatible with iPad.
Android
  • Android v5.0 or later. Compatible with tablets only.

Resources

Spectrometry Software User Guide

Spectrometry for Chromebooks

With Google’s introduction of Android apps running on Chromebooks, the PASCO Spectrometry application can now be downloaded from Google Play store and used with a growing list of compatible Chromebooks. See the following links for compatibility and installation tips.

Chrome OS Systems Supporting Android Apps »

Models labeled on this list as “Stable” currently support PASCO Spectrometry software.

Installing on Local or Unmanaged Devices »

Follow the instructions to install Google Play on your Chromebook and then download the PASCO Spectrometry app.

Installing on Managed Devices »

Follow the instructions to install Google Play on your managed Chromebooks and then download the PASCO Spectrometry app.

AYVA’s Field Trip to the Ontario Science Centre

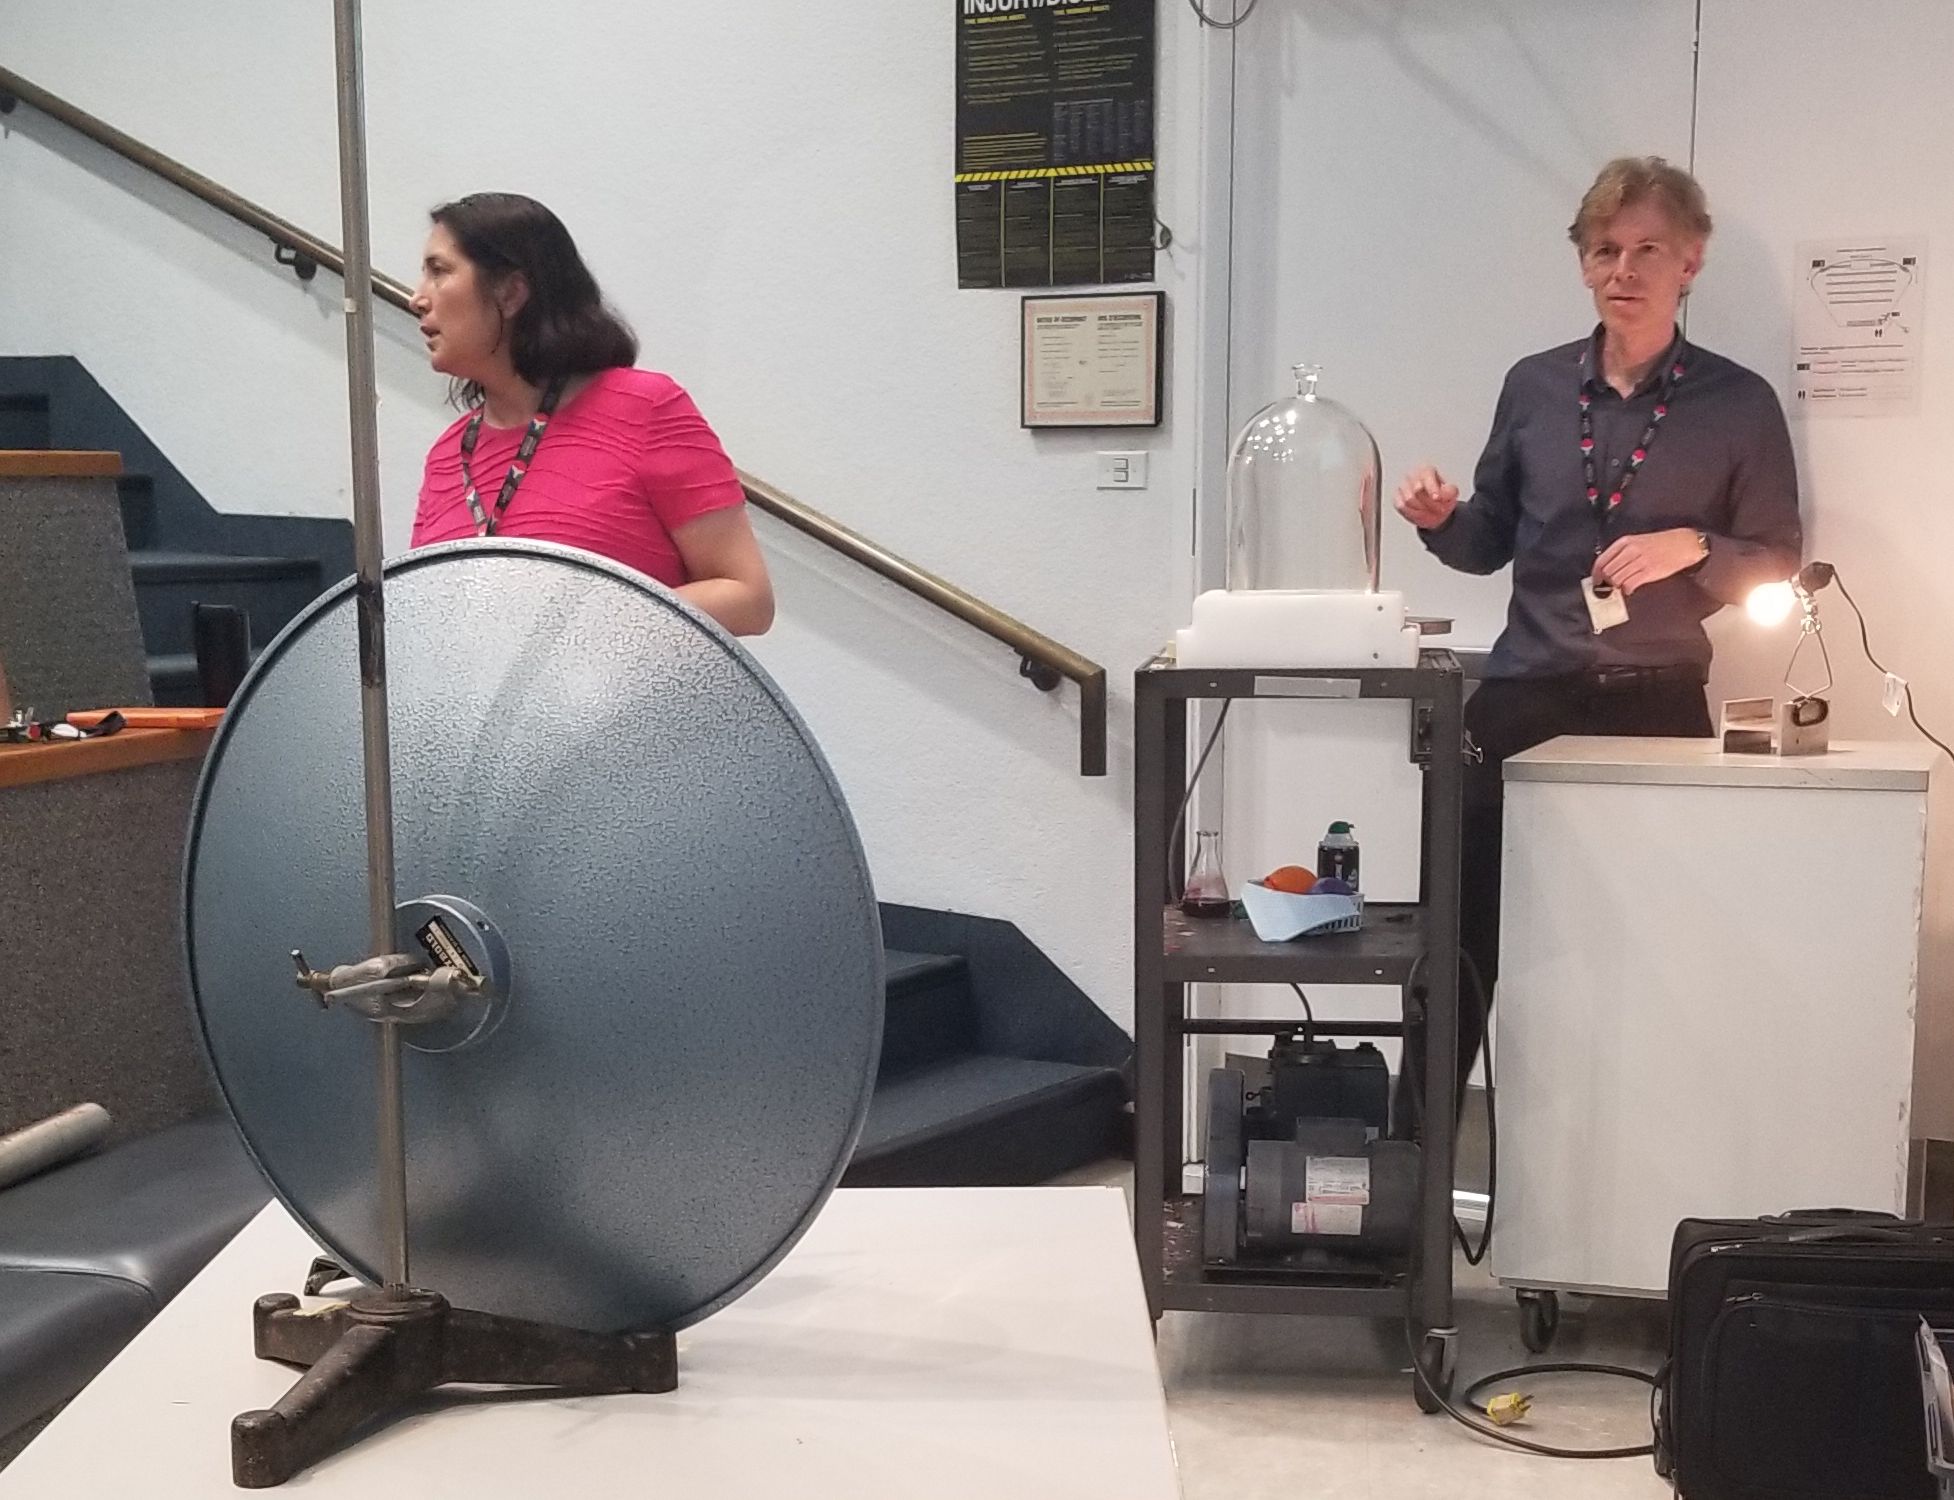
Last week, AYVA had the pleasure of demonstrating some of PASCO’s newest wireless sensors for a group of science educators at the Ontario Science Centre in Toronto, Ontario. Together we were able to come up with some fun demonstrations to get kids interested in the wonders of science.

First, we used the force platform to observe the phenomenon of your weight temporarily decreasing when your heart beats. You can look at the data and see the downward spikes occurring every second or so but how do we know that it actually corresponds to your heart rate? At the Ontario Science Centre, they have a stethoscope attached to a microphone so that we could hear the heart beat and see the weight drop simultaneously.

Next the durability of the Wireless Accelerometer was tested. The first test was standing on a desk and dropping it to observe the sensors freefall, but that wasn’t enough to satisfy these innovative educators. Their next idea was to tape the accelerometer to a baseball bat and hit the force platform covered with a layer of foam and a piece of wood.

The Wireless Temperature Link was a big hit with the science educators. For their first demonstration they placed it in a vacuum chamber along with the Wireless Pressure Sensor and graphed both pressure vs. time and temperature vs. time to look at their relationship. The Wireless Temperature Link was then placed in front of a silver dish at the focus point of a heat producing light bulb a few meters away. Even though the light bulb and the sensor had some distance between them, you could still see the temperature increasing quickly over time.

Overall, our little field trip to the Ontario Science Centre proved to be a valuable experience not only for the science educators but ourselves as well. It gave them a chance to play with some of our new technology, while coming up with new and innovative demonstrations that could be used by teachers in the classroom.

Give a scientist a sensor…

(a reflection on hosting a pro-d event)

I recently hosted my first ever professional development event.  Usually, at the local level, there aren’t many opportunities for science types.  There just aren’t enough of us and we specialize so there isn’t much common talk beyond ‘how can we get the students to love and learn science more?’.  That is why I went out of comfort zone to host an event on sensors.  I’m still not an expert on my physics equipment from PASCO let along the sensors for the other branches but I thought it was worth the shot.

How do I do a pro-d event that engages the audience?  How could I hook the teachers in attendance?  The answer was easy.  Not for me to stand there and talk at them.  No!  They needed to do science!  They needed to use the sensors.  So, that’s what we did.

I set up several stations in my room.  One for physics, one for bio, one for chem and outside for earth science.  Each station required the use of an appropriate sensor (motion, CO2, pH and weather) and a task.  I gave them as little instruction as possible beyond how to use SPARKVue.  I wanted them to experience what their students would.

I expected only my department to show up.  That is still 13 people.  I had middle school and elementary teachers show up as well.  How would they do?  The hours flew by.  I didn’t need to worry about filling the time; we needed more.  There was a buzz that you don’t hear at staff meetings.  They were engaged.  They were loving it.  They were hooked on sensors.

What I loved most was the talk on how they could use it for their classes.  I wanted to get their ideas because they would know better than I.  Every teacher left with an idea on how the sensors could be used…if only we had more.
When the day was over I was asked to host more of these.  It was very easy to say yes.

2023 Technology Catalogue Request

If you would like to receive a PASCO technology catalogue, please complete this form.

Technology Catalogue Sign Up


The View From a Small Town Physics Classroom

Let me paint you a picture. Not something physicists normally do but I’ll give it a shot.

I teach in a small town in BC. For most of my career it has been lower on the social-economic scale, a true blue-collar place but things are changing. More and more people are being pushed out of the big cities due to high house prices and ending up here where life is more laid back, more affordable, more idyllic?

Again, for most of my career the supplies I have had access to are the same supplies that came with the school when it was built…back in the 1950s. Trying to modernize my lab has been a challenge but just like the city, things are changing.

I’ve used PASCO products since my university days and have always found them to be intuitive and practical. When I had the chance, I purchased some of their GLX data loggers for demo purposes. I started to show the students the power of probeware and they yearned for more. Yes, I used yearn to describe students. I know, almost unheard of.

When I procured the funding to buy a class set of the GLXs after buying one a year for 5 years I was ecstatic. I called PASCO to order and was told that they were discontinued. I was bummed. What now? They told me about their new product, the Spark LX as a tablet data logger. I was intrigued. Many discussions happened, and I started to get on board. PASCO even took some of my suggestions about what I thought the logger should entail. After months of waiting they finally arrived; just in time for the start of a new school year.

I happily got to setting them all up and preparing their first interactions with the devices. I would use the Match-Graph software to give my physics students some hands-on real life to graph interactions. After a few hiccups of the airlinks needing firmware updates which my school computer wouldn’t allow I had the students head out into the school to test out the Spark and the software.

The looks we got from the other students and staff started as bewilderment. “What is his class up to now?” was heard more than once. My students didn’t even hear. They were too engaged to notice. The beginner graphs which were too hard mere seconds ago were now too easy. Harder graphs please. Harder and harder they went and the more competitive they got. “I’m addicted to this!” one student exclaimed. “I get it now.” Yelled another. They were hooked at first use.

I can’t wait to see how the next experiment goes. This is how technology should work in class. Relating physical experience to life experience to learning.

____
Glenn Grant has been teaching physics, math and science for 20 years in a small town called Mission, BC. 
“For most of my career I’ve been using equipment from the 1960s. I was the first person in my district to start using a Smart Board and then started getting into sensors about 10 years ago.  Since then I’ve cobbled together whatever I can to give my students access to something from the current century.  I believe that technology has a place in the classroom as a tool to further the learning.  Using the new PASCO equipment we can do labs 100 times a class and the discussion becomes more in-depth.  Why did they choose the data set they are using?  What makes that data “better”?  Can you replicate the graph on the board using the equipment.  It allows for more actual science than just content memorization. As I deepen my understanding of the equipment and its uses, I’ve been teaching the other members of my department and other teachers in the district.  I’m not an expert yet but I’m working on it.”

Titrations are pHun

Properties of acids, bases and the pH scale are core concepts in any chemistry class. After your students understand the basics, they need to be able to quantify reactions involving acids and bases with a titration.

A classic experiment is to determine the concentration of HCl(aq) by reacting it with 0.1 M NaOH(aq). To quantify this titration, and to make it more pHun, I used an indicator and a Wireless pH Sensor.

The volume of labware usually used for a titration can cause students to react with hesitation about the lab, so to keep the focus on the concepts, I minimize the amount of equipment. For a mini-titration station, I lighten the cognitive load by having students measure volumes in drops— no funnels, burets or volumetric glassware needed.

Titration1

In the setup above, I added 60 drops (~2 mL) of an unknown concentration of acid to a beaker on a magnetic stirrer. Then I used the Electrode Support to suspend a Wireless pH Sensor in the beaker with enough water to make sure the pH electrode is covered. Finally, I added a few drops of bromthymol blue indicator. I fired up SPARKvue and set up a table to manually collect pH measurements and the volume of NaOH.

Now, it was time to drop the bass base. I slowly added 0.1 M NaOH until the pH changed by 0.5 units (up to 13.0 units), recording the total drops of NaOH along the way.

Titration2

After only a few minutes, your student will have a constructed a pH titration curve with real measurements with no treble trouble. This data looks good to the last drop!

Students will be surprised at a couple of things. The number of drops needed to change the pH by 0.5 units is not always the same, and the shape of the titration curve is not a straight line, as many would have predicted.

Titration3

They will also have noticed that the indicator in the solution changed color, from yellow to blue, and there was a big jump in the pH with only 1 drop of NaOH.

So, what’s the point of all this data? In this case, there is an exact point they are looking for— the equivalence point.

Titration4

When the 60 drops of HCl were neutralized by 52 drops of 0.1 M NaOH — indicated by the color change and large jump in pH from below 7 to above 7— there were an equal number of moles of acid and base in the solution.

By incorporating the Wireless pH Sensor the students will not only perform a color-changing titration, but they will also have an opportunity to engage in some science and engineering practices with their data. And of course, have some pHun doing it!

Analysez les tendances météorologiques et améliorez la compréhension des élèves

Bryan Ouellette est un éducateur, explorateur, et enthousiaste de technologie, qui est sans cesse à la recherche de stratégies pour permettre aux étudiants l’opportunité d’apprendre d’une façon plus personnel. Avec plus de 10 ans d’expérience dans la salle de classe, dans des positions de conseilleur pour le district scolaire, ainsi qu’avec la participation dans divers comités provinciales, Bryan est engagé à transformer la classe d’école dans un environnement où l’apprentissage vient

Engage Students with Personalized Learning Strategies

Bryan Ouellette is an Educator, Explorer and overall technology Enthusiast who enjoys discovering strategies that allow students the opportunity to investigate various concepts through personalized learning. With over a decade of classroom experience, District Lead Positions and Provincial Committees, Bryan is committed to transforming classrooms into an environment where learning happens willingly.

Bryan takes a look at the new PASCO Wireless Weather Sensor, how it works and how it can be used in classrooms. This journey will not only take you from the windy parts of the prolonged winter in New Brunswick, but also to depths of the abilities that this new PASCO Weather Sensor can provide.

The Wireless Weather Sensor with GPS is an all-in-one instrument for monitoring environmental conditions. A built-in anemometer as well as sensing elements for temperature, humidity, pressure, light, and GPS the sensor provides up to 17 different measurements that can be used individually or simultaneously. Use the sensor in logging mode with the optional Weather Vane Accessory for long-term monitoring, or use it as a hand-held instrument to study microclimates and record ambient conditions relevant to many biological and environmental phenomena. Conduct GIS/mapping experiments using the onboard GPS sensor in conjunction with any of the other available measurements. The new map display in PASCO’s SPARKvue software provides a way for students to analyze spatial data.


Products shown:

Save & Share Cart
Your Shopping Cart will be saved and you'll be given a link. You, or anyone with the link, can use it to retrieve your Cart at any time.
Back Save & Share Cart
Your Shopping Cart will be saved with Product pictures and information, and Cart Totals. Then send it to yourself, or a friend, with a link to retrieve it at any time.
Your cart email sent successfully :)